Using data from the Edinburgh Festival Fringe box office, Creative Informatics Research Associate Vikki Jones has worked in partnership with the Edinburgh Festival Fringe Society to produce an open audience insights map as part of the Edinburgh Culture and Communities Mapping Project.
NEWS | VIKKI JONES 04 AUGUST 2023
Funded by the Data-Driven Innovation initiative (DDI) as part of their 2022/23 small grants call supporting social change through innovation, the Edinburgh Festival Fringe Open Audience Insights Map sits alongside Vikki’s previous work with the Edinburgh Culture and Communities Mapping Project, led by Dr Morgan Currie.
This project also aligns with previous work by Creative Informatics in mapping freelancers in the creative industries that took place in 2020–2021.
Cultural mapping at the Edinburgh Festival Fringe
Building on existing research and resources – including the 2021 Mapping Cultural Dispersal Project (Jones & Currie, 2022) and the ongoing Festivals and Communities Map – this project sought to explore ways to address the challenge of making data about ticket-buying audiences at the Edinburgh Festival Fringe open and accessible, democratising access to data for Fringe artists, producers and audiences.
The research was designed to consider and document the process of making the Open Audience Insights Map, as well as to analyse the data it holds and presents. As such, the project explored the stories that could be told through or supported by the map about the multiple value systems and economies that interoperate at the Fringe and how these were dispersed across the city. User testing with the Fringe Society included discussion of the opportunities and challenges of working with the map and the broader principles of open data ambitions for the Fringe specifically, and for cultural organisations and events more broadly.
Through these conversations the map was able to act as a tool through which to think about what skills, literacies and partnerships would need to be in place to allow this map and similar resources to facilitate data-driven planning and decision making for the Society and for Fringe artists, producers and audiences. The project was developed in alignment with the practice of cultural mapping, which is at the heart of the Edinburgh Culture and Communities Mapping Project’s work, which offers new ways of interrogating, exploring and understanding cultural assets and access to them:
“Cultural mapping, broadly conceived, promises new ways of describing, accounting for, and coming to terms with the cultural resources of com- munities and places.” (Duxbury et al., 2015, p.2)
As a result of these different approaches to visualising culture, and the ways in which cultural mapping offers a tool to work with communities and places as well as to conduct research about them, the practice can be seen as:
“a democratic approach to regional cultural policy – both in terms of who can define and access culture and shape cultural policy and in terms of what gets counted and funded as part of the cultural landscape.” (Currie & Correa, 2021, p.90)
For the Edinburgh Festival Fringe, the unique nature of its open access programme and its vision “to give anyone a stage and everyone a seat” (Edinburgh Festival Fringe Society, 2022), creates a multi-perspective and multi-stakeholder landscape of interest and investment in the festival. This research suggests that these intersecting perspectives, economies and values could be democratically communicated and approached using the Open Audience Insights Map, both by the Fringe Society in its artist support services, and by artists, producers and audiences themselves.
Features of the Open Audience Insights Map
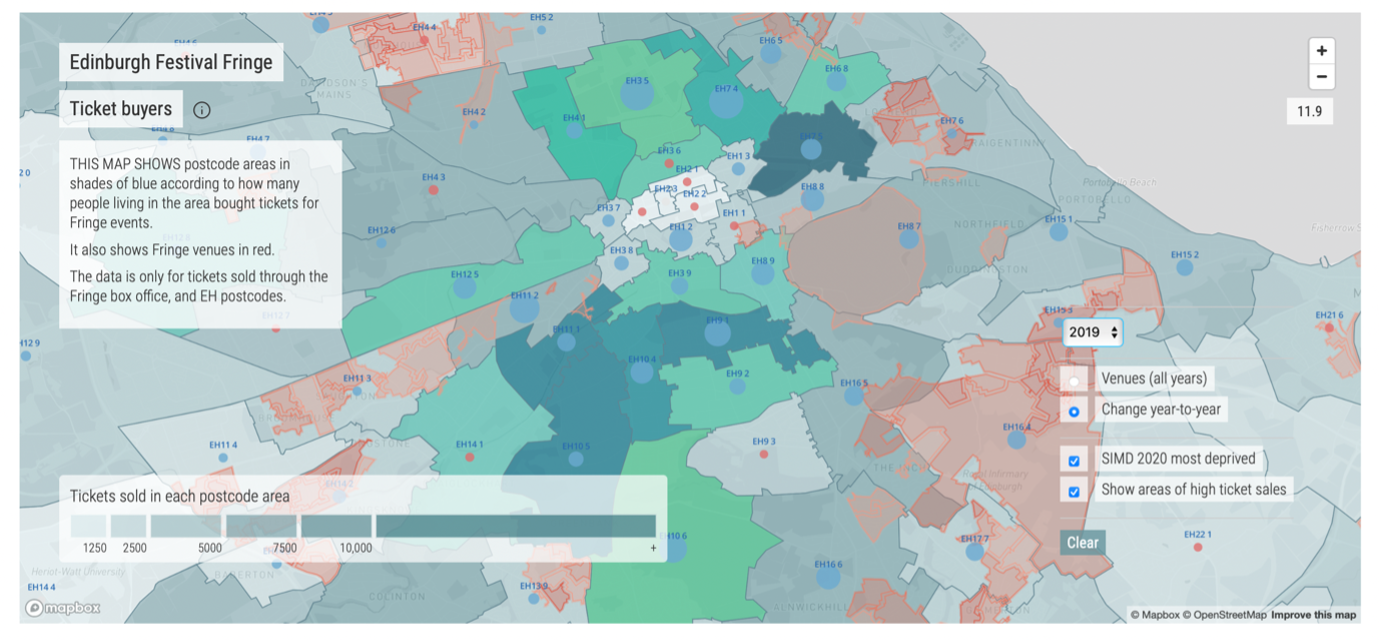
The map shows information about Edinburgh Festival Fringe tickets sold through the Fringe box office to those whose registered purchase address was in an EH postcode. The data is aggregated by postcode area. It also shows Fringe venues over the period of data on the map (2017–2022); data zones from the Scottish Index of Multiple Deprivation (https://simd.scot) that show the most deprived areas in the region (bottom three deciles); and plots year-to-year changes in ticket buying in postcode areas.
Findings from the research
In exploring the idea of open audience insights for the Fringe, we found huge potential for data-driven tools like this map that might assist decision making about the festival experience – from where to find venues to put on a show, to locations suitable for face-to-face promotions, and areas which might offer new experiences for visitors and artists outside of high footfall areas, or in parts of Edinburgh they hadn’t explored before.
Representations of year-to-year change in ticket-buying audiences offer insight into where promotion of the festival in certain postcode areas might have been successful in growing audiences. This links to the Culture and Communities Mapping Project’s Mapping Cultural Dispersal report (Jones & Currie, 2022), which recommended festivals in Edinburgh place greater emphasis on promotion of core programmes to communities in the city. On this map, in postcode areas with high numbers of ticket purchases these areas have been further broken down on the map to show variation in this data.
There are challenges, however, with what the data presented on the map can, an cannot, tell us. For example, there are issues of granularity in the data in that complete postcode data has the potential to identify individual households and so, for ethical reasons, this level of data is not included. The map does not include any general demographic information about each postcode area which might help account for year-on-year variation in ticket buying, although conversely, it could be argued that high ticket-buying areas might offer insights into the demographics of the people who live there.
In testing the map with the Edinburgh Festival Fringe Society, we discussed how data skills and literacies – both within the Society and for the festival participants they support – with tools such as this might change the nature of these interactions. Rather than approaching the map as a way to provide definitive answers to questions posed by Fringe artists, audiences and other stakeholders, in developing use cases for the map it was felt to act as a tool for storytelling and exploration around questions about accessing the festival.
Further development
The work conducted on this project so far has produced a map which begins to tell varied, interesting and complex stories about ticket buying audiences at the Fringe. We hope to be able to continue to iterate and develop the Open Audience Insights Map towards more dynamic visualisations of the data it holds, as well as continuing to explore the principles of data-driven decision making and open and collaborative digital tools for festivals in the region.
Bibliography
Currie, M. & Correa, M.M. (2021). Tangibles, intangibles and other tensions in the Culture and Communities Mapping Project. Cultural Trends, 31(1), 88-106. https://doi.org/10.1080/09548963.2021.1910491.
Duxbury, N. Garrett-Petts, W.F., & MacLennan, D. (2015). Cultural mapping as cultural inquiry. Routledge.
Edinburgh Festival Fringe Society. (2022). Fringe development goals. https://www.edfringe.com/about/about-us/fringe-development-goals [Accessed 28 July 2023]
Jones, V. & Currie, M. (2022). Mapping Cultural Dispersal report. https://www.edinburghculturalmap.org/research/mapping-cultural-dispersal-report/. [Accessed 28 July 2023]


")
")